Visual Changelog for v0.13.0
The v0.13.0 release of the Logfile Navigator has some major changes that I’ll go over here. I’ve also recorded a video covering some of the changes if you want to see some of the features in action:
New Prompt
From the beginning, lnav used the readline library for handling the command prompt at the bottom of the screen. It worked. But that solution had many limitations: simplistic tab-completion; complicated integration, which used a separate process; glitchy syntax highlighting; lack of multi-line support.
To address these limitations, I’ve written a custom text input widget. The new widget should maintain almost all of the existing functionality of readline (except for the readline configuration file) while also improving the overall experience.
The following sub-sections highlight some of the new functionality.
History
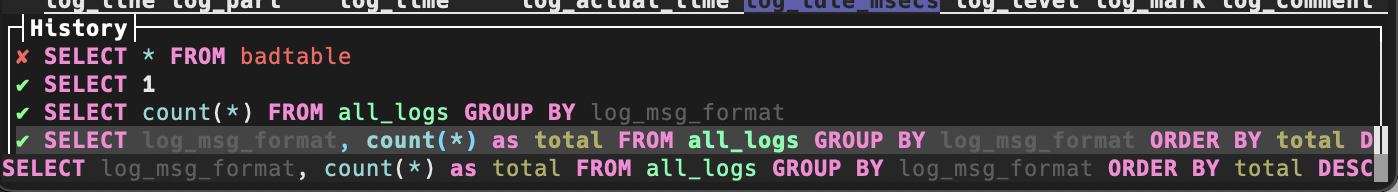
History search can be activated with CTRL-R
and is a fuzzy search now. The history is also
kept in a SQLite DB so that it is saved immediately
and available across sessions. The status of the
executed command is also saved and shown in the
history so it is easy to see what worked or did not.
Search Suggestions
Searching for a phrase is now easier because lnav will automatically suggest the next word from the display. For example, when searching for “release the kraken”, typing “release” followed by a space will suggest “the”. Pressing TAB will then complete “the” and then pressing SPACE will suggest “kraken”.
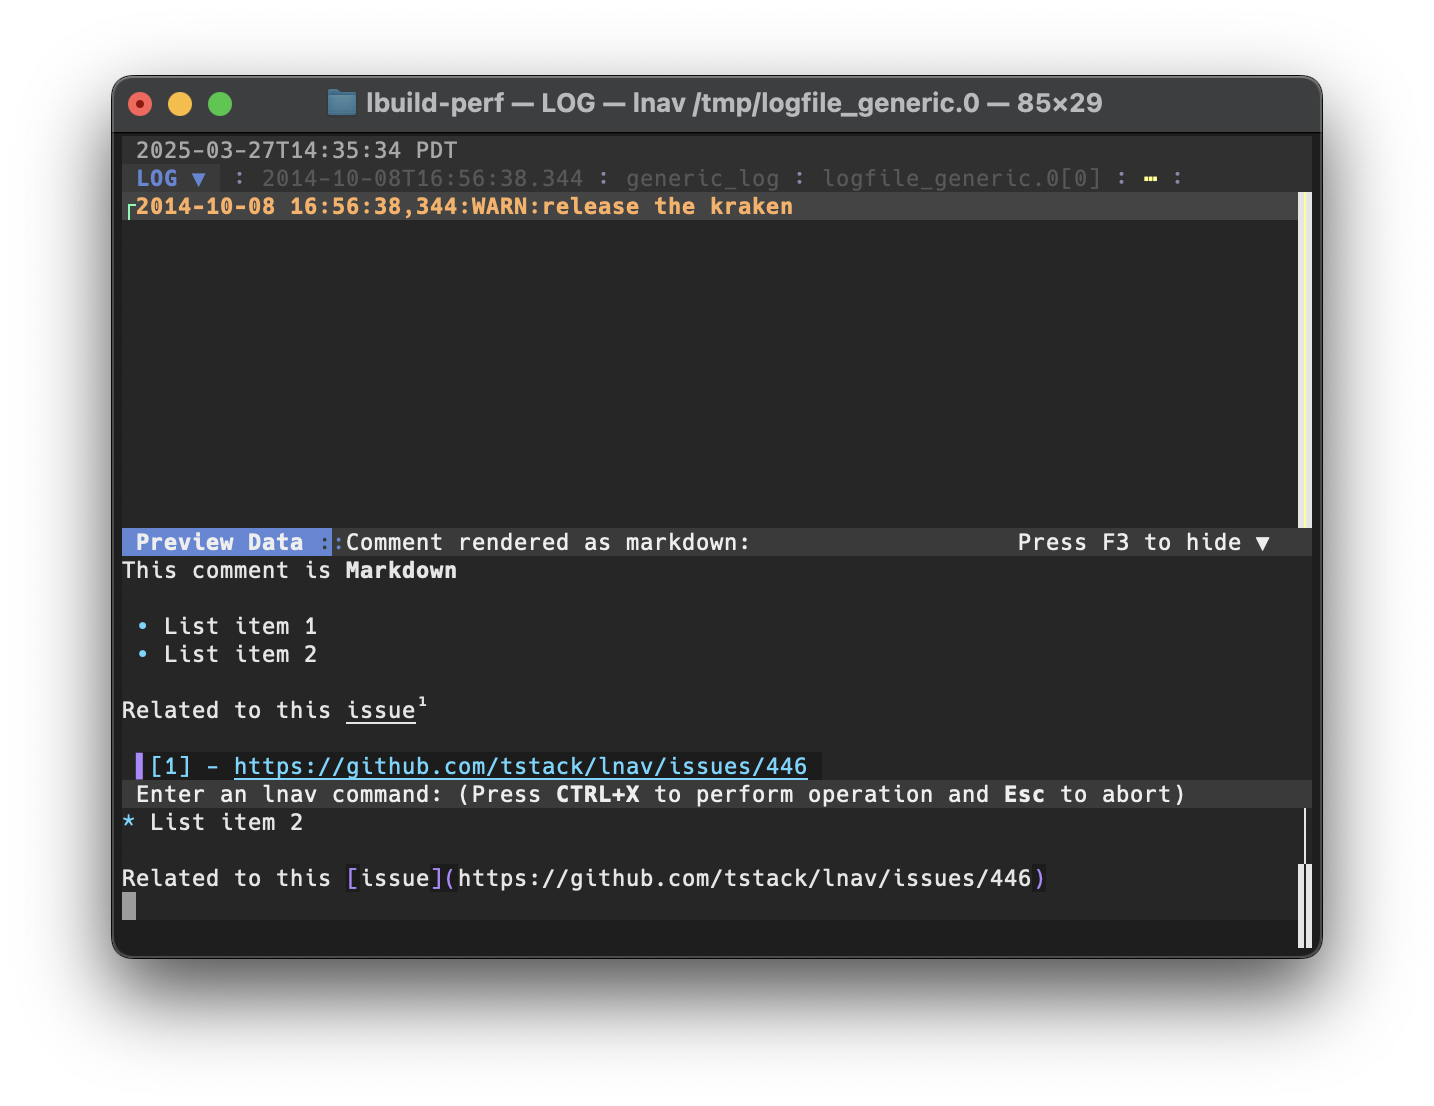
Comment Command
The :comment command, if you aren’t already
familiar, allows you to attach a textual comment
to a log message. The comment will show up below
the log message and can be styled using Markdown
syntax.
Writing a comment in a single line as afforded
by readline was pretty cumbersome. If you wanted
to add a new line, you had to insert a \n.
Now, with the new implementation, when you enter
:comment , the prompt will immediately switch
to multi-line mode. Markdown syntax is now
highlighted and the rendered version will be
shown in the preview panel. To make comments
even more useful, you can add links to messages
using permalinks (see below). Clicking the link
in the comment will jump the view to the targeted
message.
Code blocks with the language set to lnav will
display a “play” button next to commands that
you can click on to execute the command. This
can be useful for saving commands/queries that were
useful when you were debugging something.
DB Statements
The other functionality that benefits greatly from
a multi-line prompt is entering DB statements.
The SQL prompt starts in single-line mode, but can
easily be switched to multi-line by pressing
CTRL-L. The switch to multi-line will also
reformat the SQL/PRQL statement to split it over
multiple lines.
Cut to the System Clipboard
Cutting text in the prompt using the keyboard shortcuts now copies the text to the system clipboard.
Saving the Prompt Contents
If you want to export the prompt contents to edit
in another editor or for some other reason, you
can press CTRL-O to save to a file named
saved-prompt.lnav. The file is saved in the
lnav formats/installed directory so that it
can be executed using |saved-prompt. Also,
if VS Code is available, it will be called to
edit the file since there is an lnav extension
available. A different editor can be used by
changing the /tuning/external-editor
configuration.
Mouse Support
Finally, the prompt has support for mouse input. Left-click will position the cursor. Click-drag to select a range of text. A right-click will copy the selection to the system clipboard.
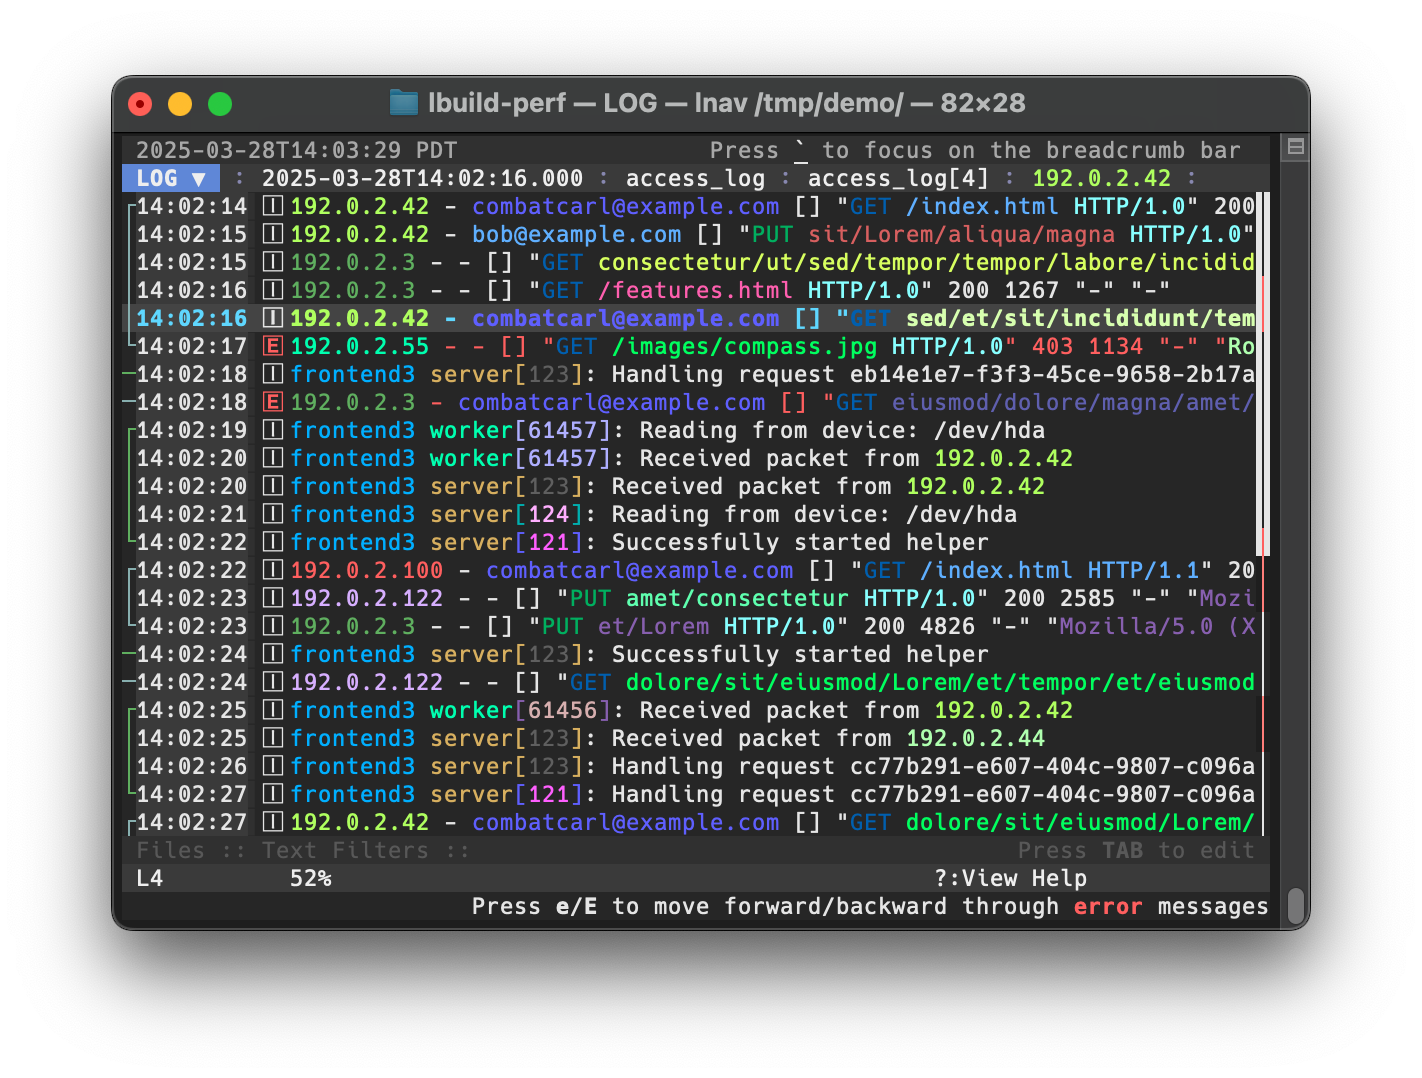
Time Column
The “time column” feature displays an abbreviated timestamp and log level in a column on the left when enabled, while also hiding the original timestamp and level. The column reduces the size of log messages and aligns timestamps/log-levels across log formats to make for easier reading. Enabling the column is done simply by scrolling to the right. Scrolling left will disable the column and display the full log message as usual.
This feature is gated by the /ui/views/log/time-column
setting, with the following values:
disabled: scrolling right works as normal and does not insert the time column.enabled: scrolling right enables the time column.default: the time column is enabled and the default on startup.
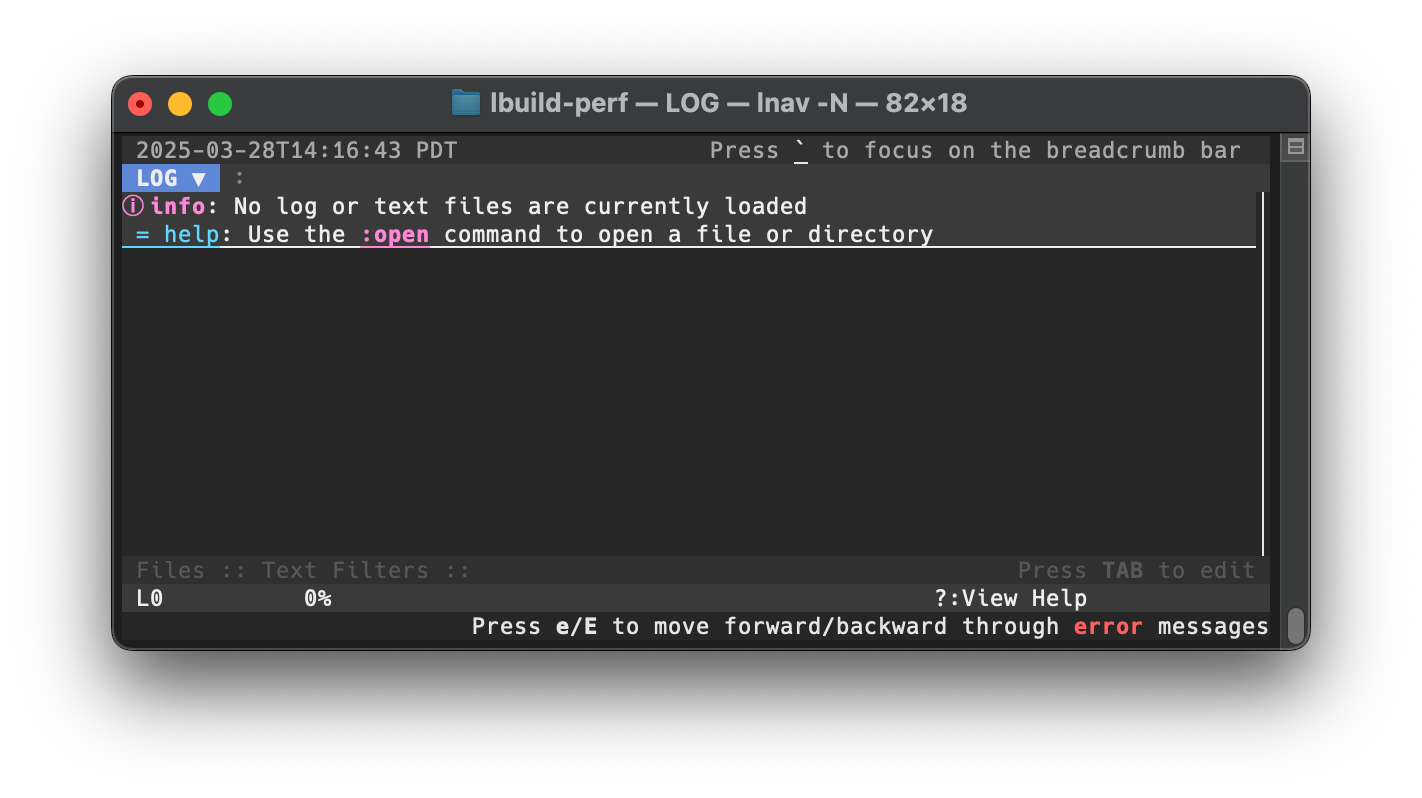
Empty View Messages
If no files are loaded into the LOG or TEXT views,
a message will be displayed to give you a hint to
use the :open command or switch the view.
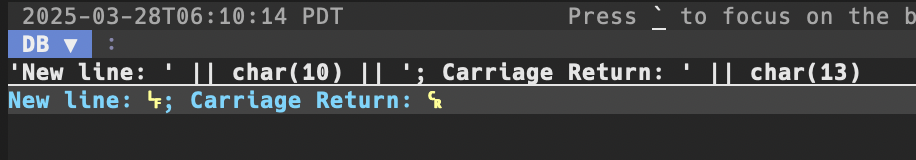
Control Characters in Table Cells
In the DB view, table cells will now display non-printable characters as their unicode symbols and highlighted in yellow.
Permalinks for Log Messages
Log messages now have permalinks that can be used
to reference them from other locations. The
permalink for a message is shown in the parser
details overlay (activated by pressing p).
Selecting the “Permalink:” line in the overlay and
then pressing c will copy the link to your
clipboard. The link is also available in the
log_line_link column of the log tables. These
permalinks can be used with the :goto command
to move to the log message.
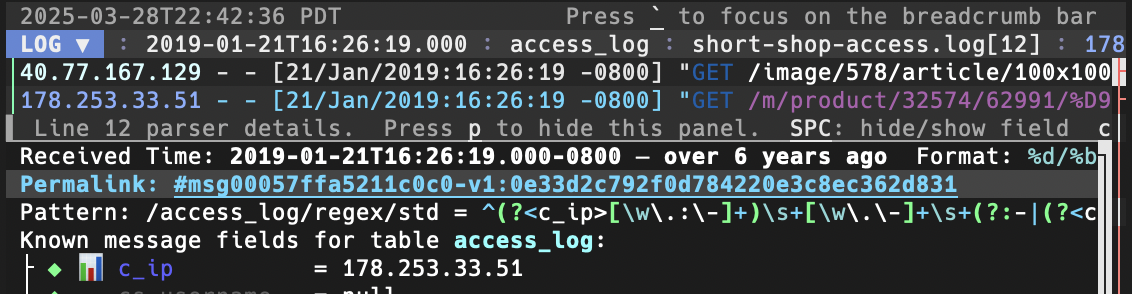
p.
The link can by copied by focusing on the
line and pressing c.
“Measure” Collation Function
A measure_with_units SQLite collation function has been
added that can compare numbers with unit suffixes,
like “10KB” or “1.2ms”. The :create-search-table
command will also use this collation function for
capture patterns that are likely to capture a number
with a unit. Associating the correct collation
function means that sorting will work correctly.
For example, “1KB” will be greater than “5B”.
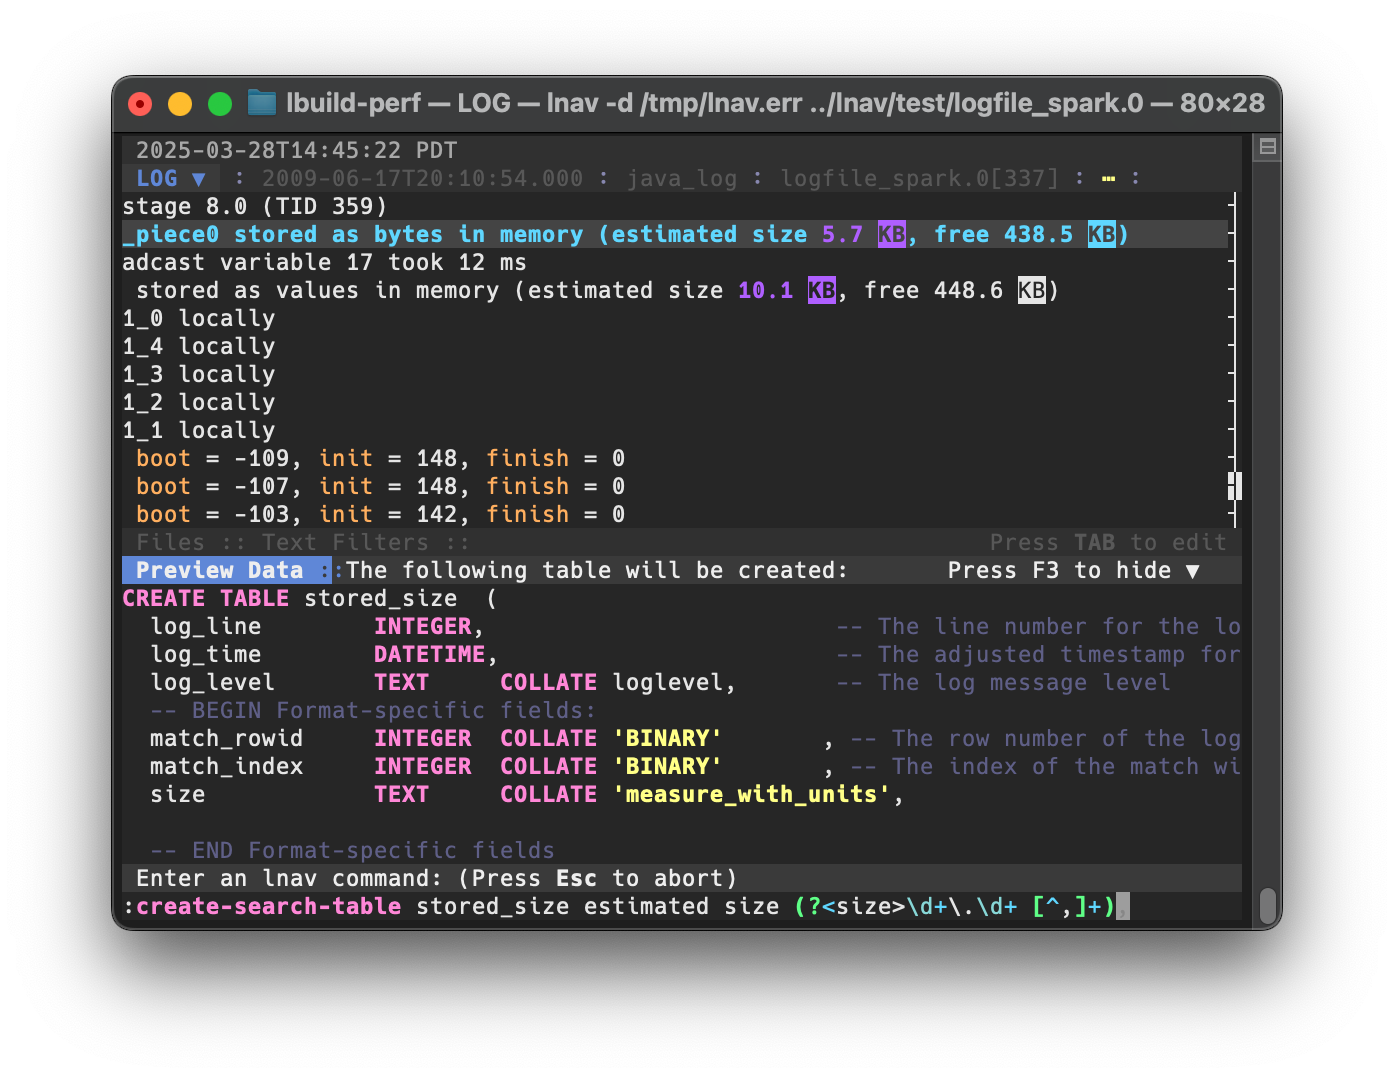
:create-search-table command
creates the table column with the
measure_with_units collation since
the size capture only recognizes
a number followed by a suffix.