Features
- Single Log View
- Automatic Log Format Detection
- Filters
- Timeline View
- Pretty-Print View
- Query Logs Using SQL
- “Live” Operation
- Themes
- Syntax Highlighting
- Tab-completion
- Custom Keymaps
- Sessions
- Headless Mode
Single Log View
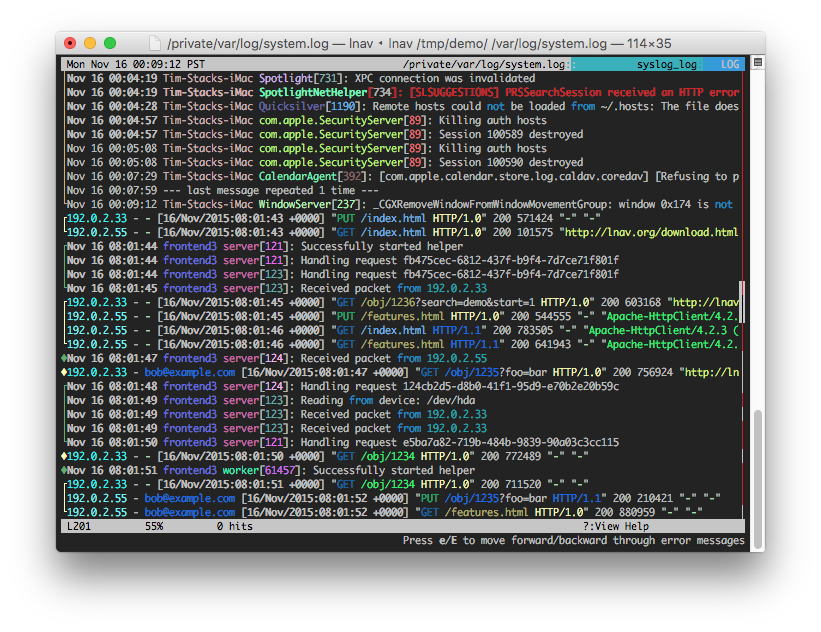
All log file contents are merged into a single view based on message timestamps. You no longer need to manually correlate timestamps across multiple windows or figure out the order in which to view rotated log files. The color bars on the left-hand side help to show which file a message belongs to.
Automatic Log Format Detection
The log message format is automatically determined by lnav while scanning your files. The following are some of the formats that are built in by default:
- Common Web Access Log format
- W3C Extended Log File Format
- logfmt
- CUPS page_log
- Syslog
- Glog
- VMware ESXi/vCenter Logs
- dpkg.log
- uwsgi
- “Generic” - Any message that starts with a timestamp
- Strace
- sudo
If your log file format is JSON-lines or can be matched by a PCRE regular expression, you can define your own format in a JSON file.
GZIP’ed and BZIP2’ed files are also detected automatically and decompressed on-the-fly.
Filters
Display only lines that match or do not match a set of regular expressions. Useful for removing extraneous log lines that you are not interested in.
Timeline View
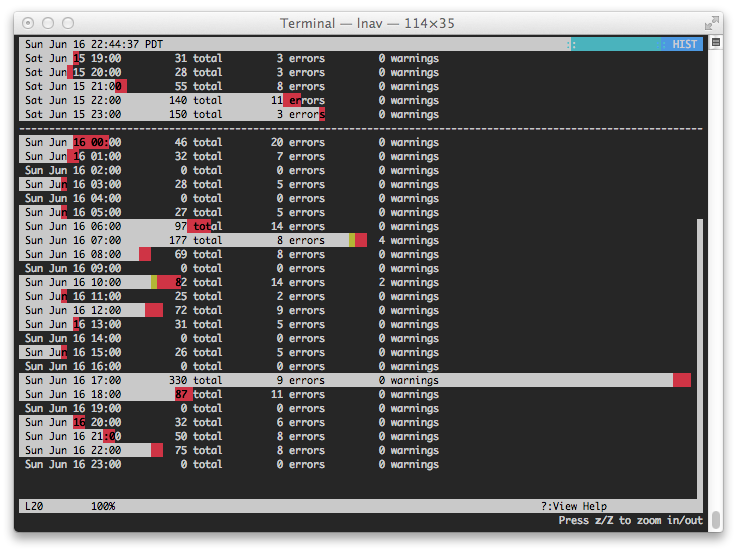
The timeline view shows a histogram of messages over time. The number of warnings and errors are highlighted in the display so that you can easily see where problems have occurred. Once you have found a period of time that is of interest, a key-press will take you back to the log message view at the corresponding time.
Pretty-Print View
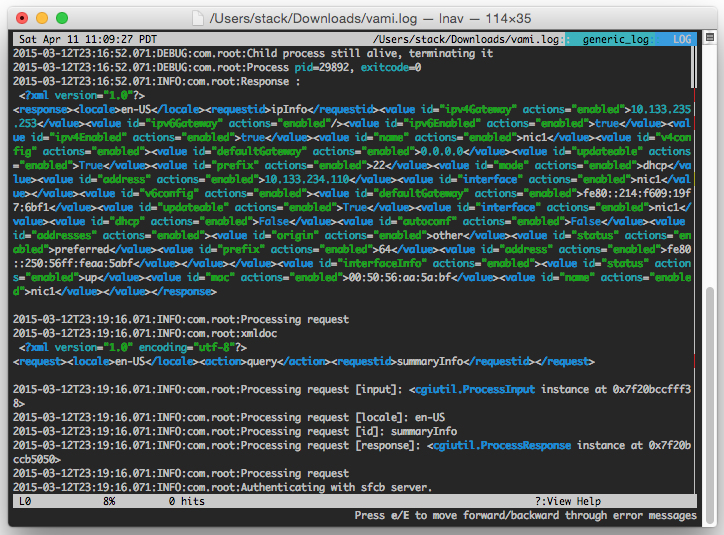
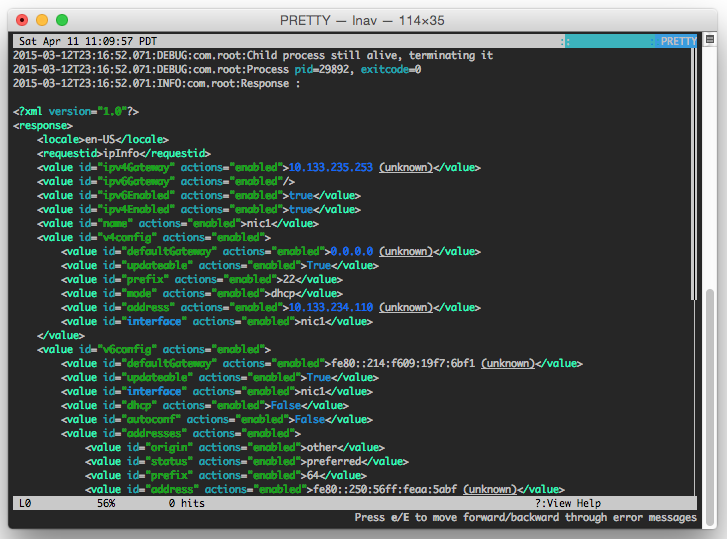
The pretty-print view will reformat structured data, like XML or JSON, so that it is easier to read. Simply press SHIFT+P in the log view to have all the currently displayed lines pretty-printed.
The following screenshot shows an XML blob with no indentation:
After pressing SHIFT+P, the XML is pretty-printed for easier viewing:
Query Logs Using SQL
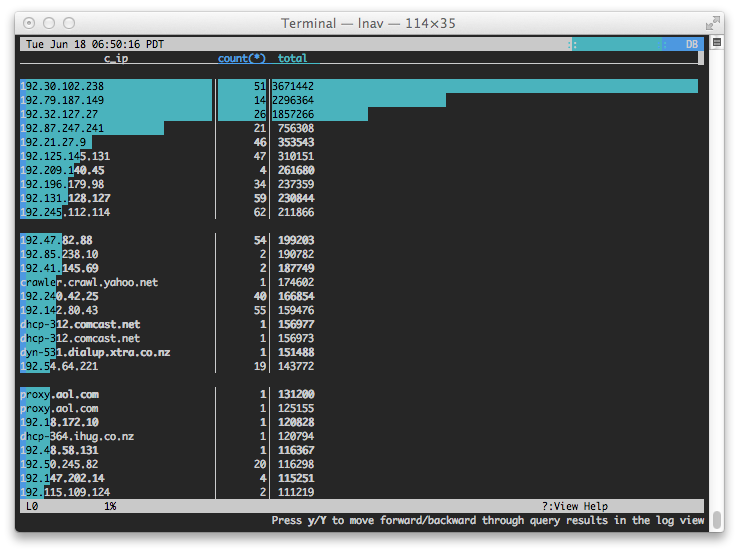
Log files are directly used as the backing for SQLite virtual tables. This means you can perform queries on messages without having to load the data into an SQL database. For example, the screenshot below shows the result of running the following query against an Apache access_log file:
SELECT c_ip, count(*), sum(sc_bytes) AS total FROM access_log
    GROUP BY c_ip ORDER BY total DESC;
“Live” Operation
Searches are done as you type; new log lines are automatically loaded and searched as they are added; filters apply to lines as they are loaded; and, SQL queries are checked for correctness as you type.
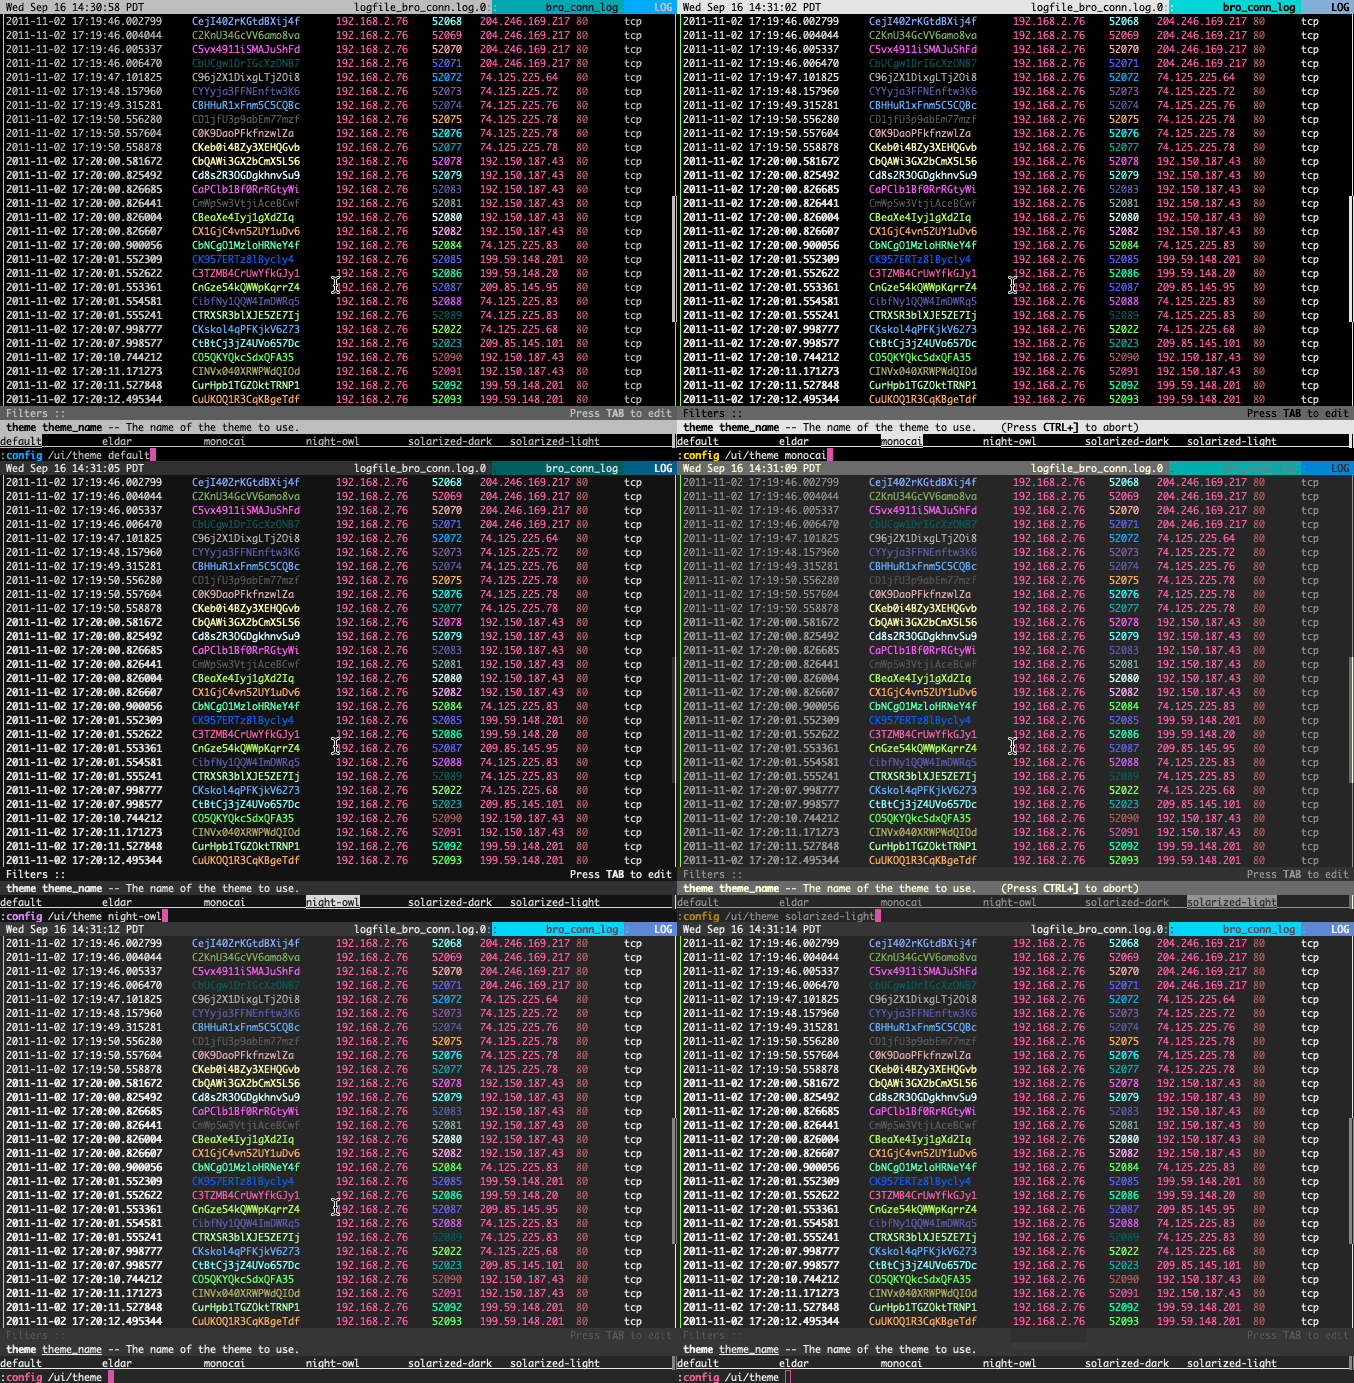
Themes
The UI can be customized through themes.
Syntax Highlighting
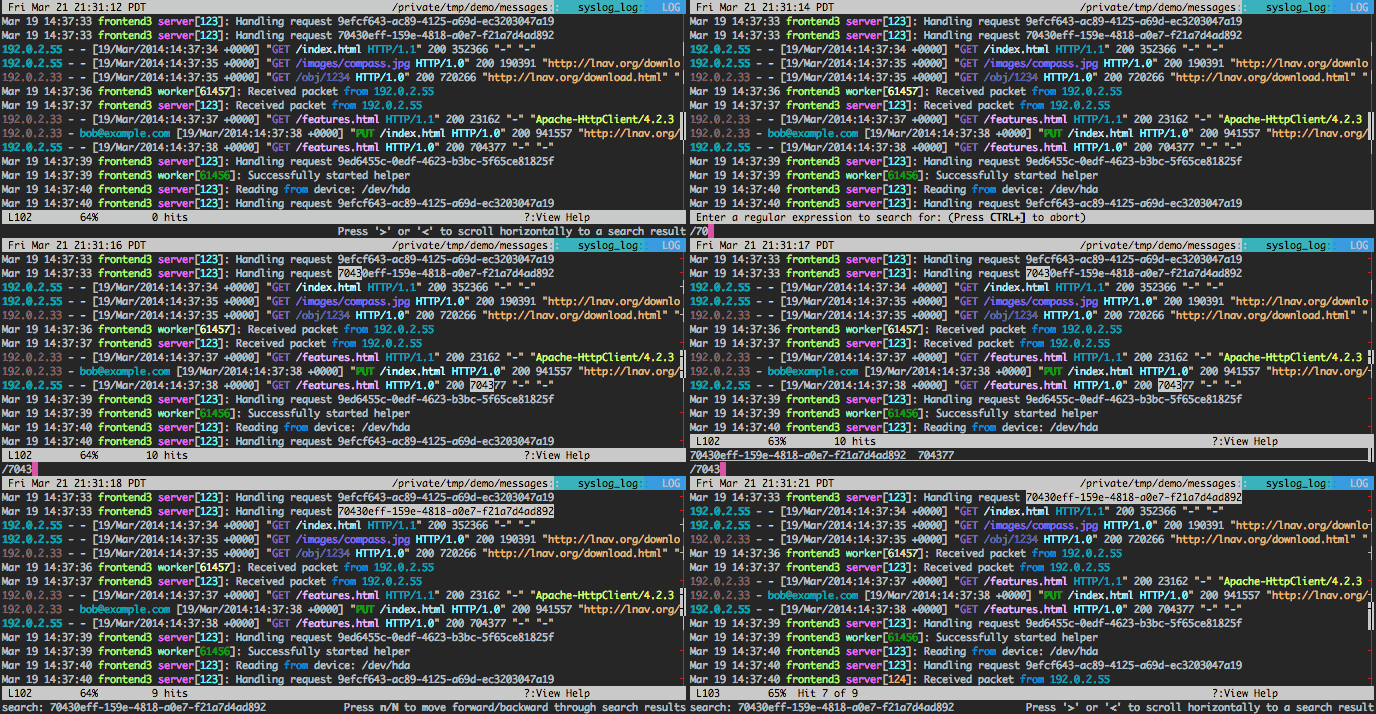
Errors and warnings are colored in red and yellow, respectively. Highlights are also applied to: SQL keywords, XML tags, file and line numbers in Java backtraces, and quoted strings. The search and SQL query prompt are also highlighted as you type, making it easier to see errors and matching brackets.

Tab-completion
The command prompt supports tab-completion for almost all operations. For example, when doing a search, you can tab-complete words that are displayed on screen rather than having to do a copy & paste.
Custom Keymaps
Hotkeys can be customized to run lnav commands or scripts.
Sessions
Session information is saved automatically and restored when you are viewing the same set of files. The current location in files, bookmarks, and applied filters are all saved as part of the session.
Headless Mode
The log processing features of lnav can be used in scripts if you have a canned set of operations or queries that you want to perform regularly. You can enable headless mode with the ‘-n’ switch on the command-line and then use the ‘-c’ flag to specify the commands or queries you want to execute. For example, to get the top 10 client IP addresses from an apache access log file and write the results to standard out in CSV format:
$ lnav -n \
    -c ';SELECT c_ip, count(*) AS total FROM access_log GROUP BY c_ip ORDER BY total DESC LIMIT 10' \
    -c ':write-csv-to -' \
    access.log

c_ip,total
10.208.110.176,2989570
10.178.4.102,11183
10.32.110.197,2020
10.29.165.250,443