I recently stumbled on this nice review of lnav
by José Lopes. They use this Hammered
challenge by cyberdefenders.org as a way to get to
know how to use lnav. I thought I would do the same and document the commands
I would use to give folks some practical examples of using lnav.
(Since I’m not well-versed in forensic work, I followed this great
walkthrough.)
Q1: Which service did the attackers use to gain access to the system?
We can probably figure this out by looking for common failure messages
in the logs. But, first, we need to load the logs into lnav. You
can load all of the logs by passing the path to the Hammered directory
along with the -r option to recurse through any subdirectories:
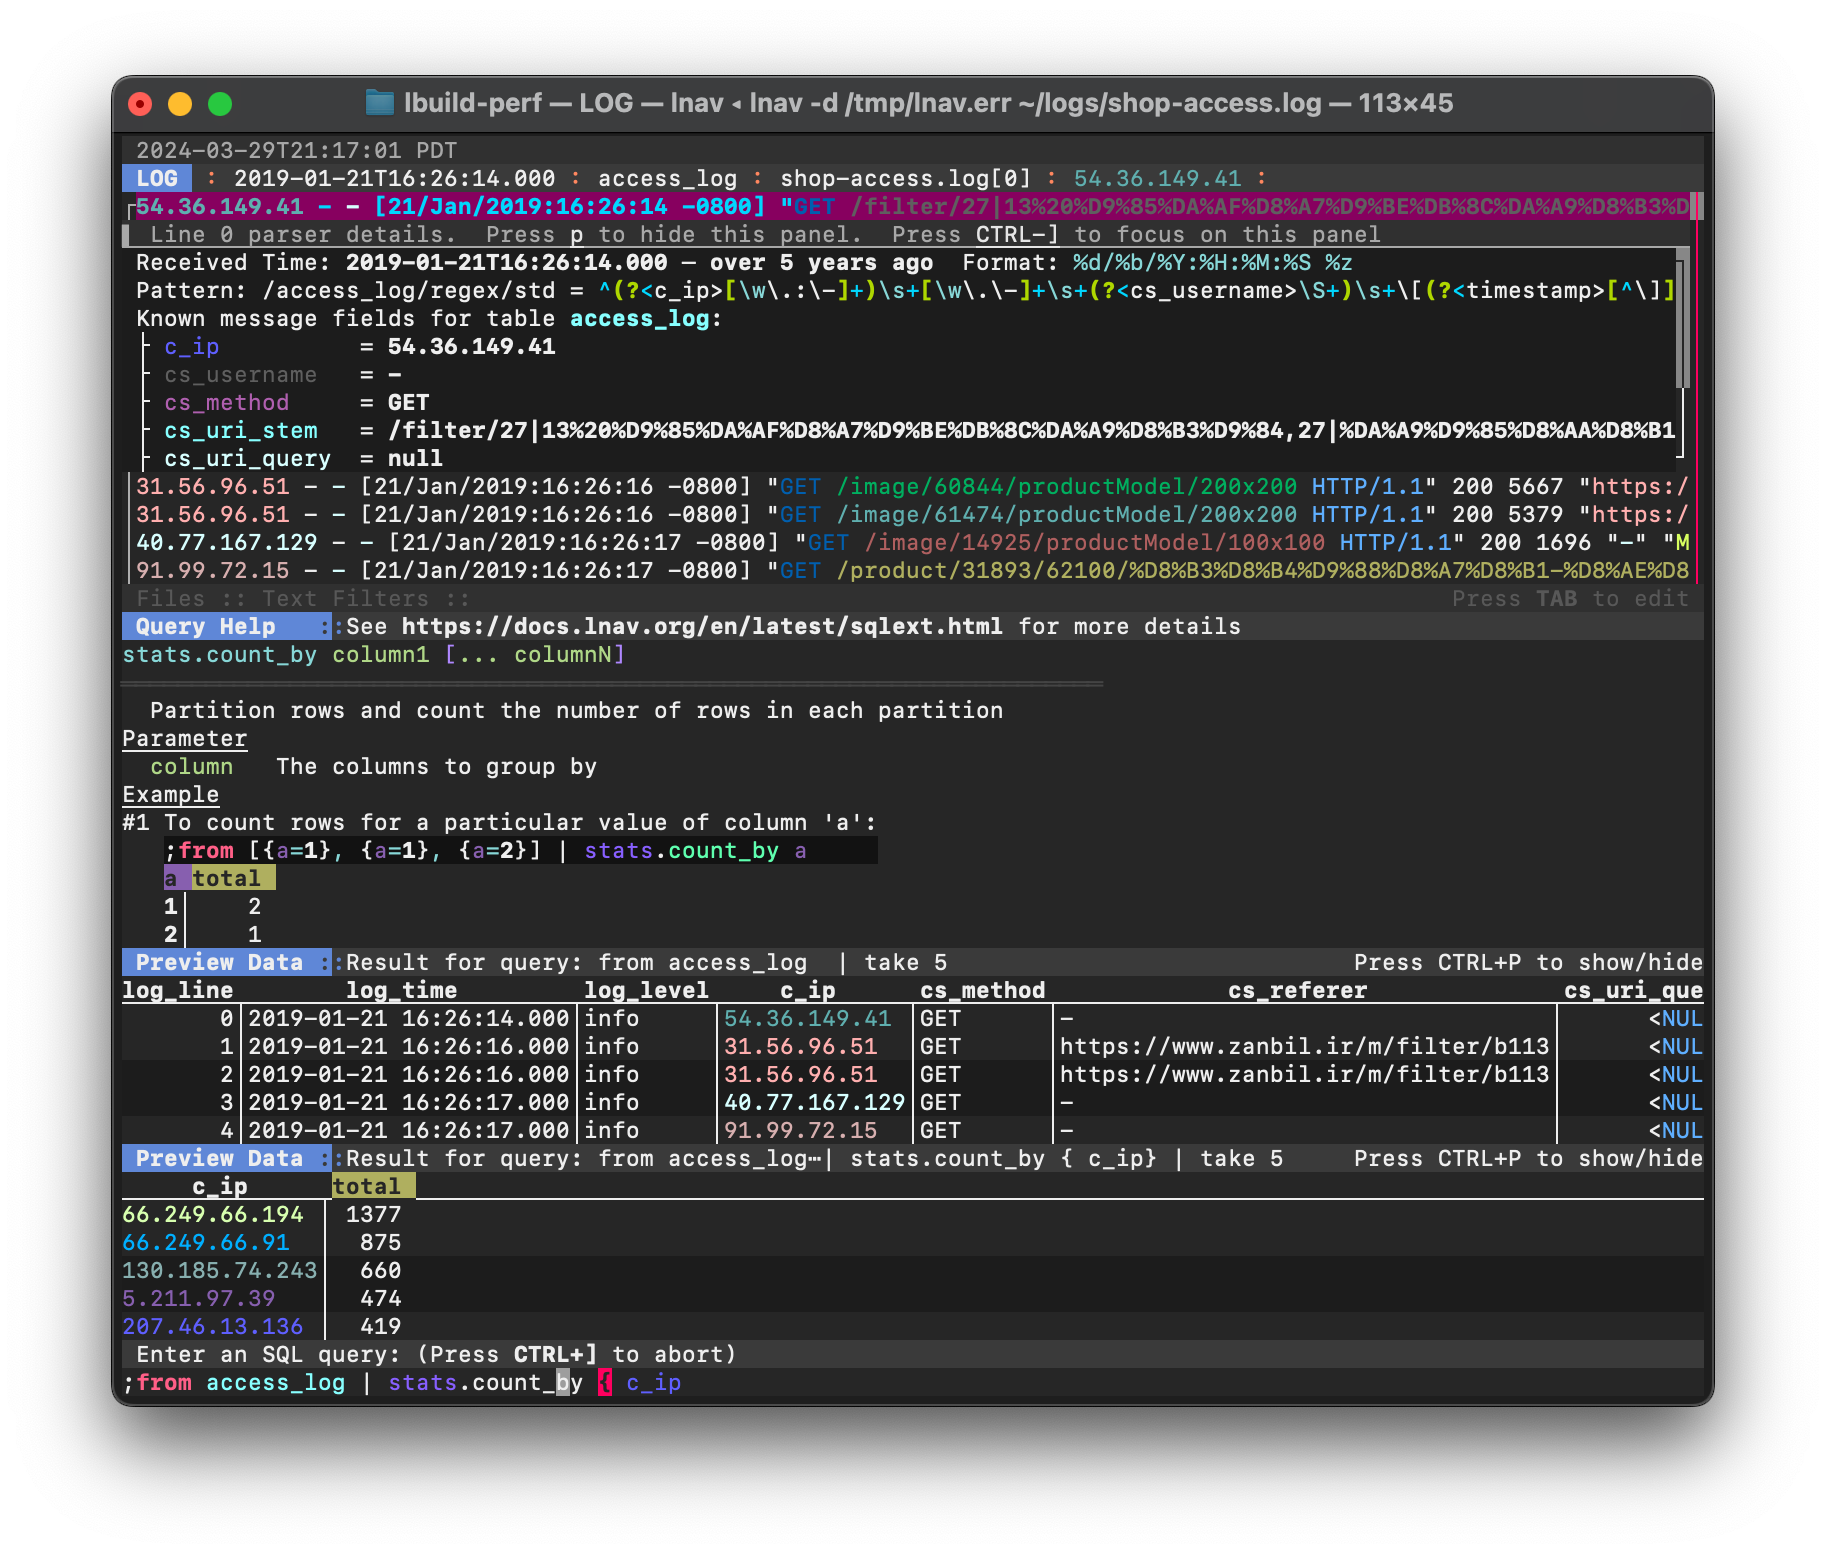
Now that the logs are loaded, you can use the .msgformats SQL command
to execute a canned query that finds log messages with a common text
format. (Unfortunately, this command has suffered from bitrot and is
broken in the current release. It will be fixed in the next release.
In the meantime, you can copy the snippet below
to a file and execute it using the | prompt.) You can enter the
SQL prompt by pressing ; and then entering the command or statement:
The top results I get for this batch of logs look like the following.
┏━━━━━┳━━━━━━━━┳━━━━━━━━━━━━━━━━━━━━━━━┳━━━━━━━━━━━━┳━━━━━━━━━━━━━━━━━━━┳━━━━━━━━━━━━━━━━━━━━━━━━━━━━━━━━━━━━━━━━━━━━━━━━━━━━━━━━━━━━━━━━━━━━━━━━━━━━━━━━━━━━━━━━━━━━━━━━━━━━━━━━━━━━━━━━━━━━┓
┃total┃log_line┃       log_time        ┃  duration  ┃    log_formats    ┃                                                   log_msg_format                                                   ┃
┡━━━━━╇━━━━━━━━╇━━━━━━━━━━━━━━━━━━━━━━━╇━━━━━━━━━━━━╇━━━━━━━━━━━━━━━━━━━╇━━━━━━━━━━━━━━━━━━━━━━━━━━━━━━━━━━━━━━━━━━━━━━━━━━━━━━━━━━━━━━━━━━━━━━━━━━━━━━━━━━━━━━━━━━━━━━━━━━━━━━━━━━━━━━━━━━━━┩
│15179│     798│2010-03-16 08:12:09.000│47d14h59m04s│syslog_log         │#): session closed for user root                                                                                    │
│14500│     817│2010-03-16 08:17:01.000│47d14h54m00s│syslog_log         │#): session opened for user root by (#)                                                                             │
│14480│   29380│2010-04-19 04:36:49.000│7d04h03m45s │syslog_log         │pam_unix(sshd:auth): #; #                                                                                           │
│14478│   29381│2010-04-19 04:36:49.000│7d04h03m45s │syslog_log         │#): #; logname= #                                                                                                   │
│ 6300│   74477│2010-04-20 06:57:11.000│6d03h00m42s │syslog_log         │: [#]: IN=# OUT=# MAC=# SRC=# DST=# LEN=# TOS=# PREC=# TTL=# ID=# PROTO=# SPT=# DPT=# LEN=#                         │
│ 5848│    4695│2010-03-18 11:38:04.000│38d21h13m39s│syslog_log         │#): #; logname= #                                                                                                   │
│ 5479│   16164│2010-03-29 13:23:46.000│27d19h27m58s│syslog_log         │Failed password for root from # port # #                                                                            │
...
The # in the log_msg_format column are the parts of the text
that vary between log messages. For example, the most interesting
message is “Failed password for root from # port # #”. In that case,
the first # would be the IP address and then the port number. The
first column indicates how many times a message like this was found,
so 5,479 failed password attempts is probably a good sign of a breakin
attempt.
To find out the service that logged this message, you can scroll down
to focus on the message and then press Shift + Q to return to the
LOG view at the line mentioned in the log_line column. In this case,
line 16,164, which contains:
Mar 29 13:23:46 app-1 sshd[21492]: Failed password for root from 10.0.1.2 port 51771 ssh2
So, the attack vector is sshd.
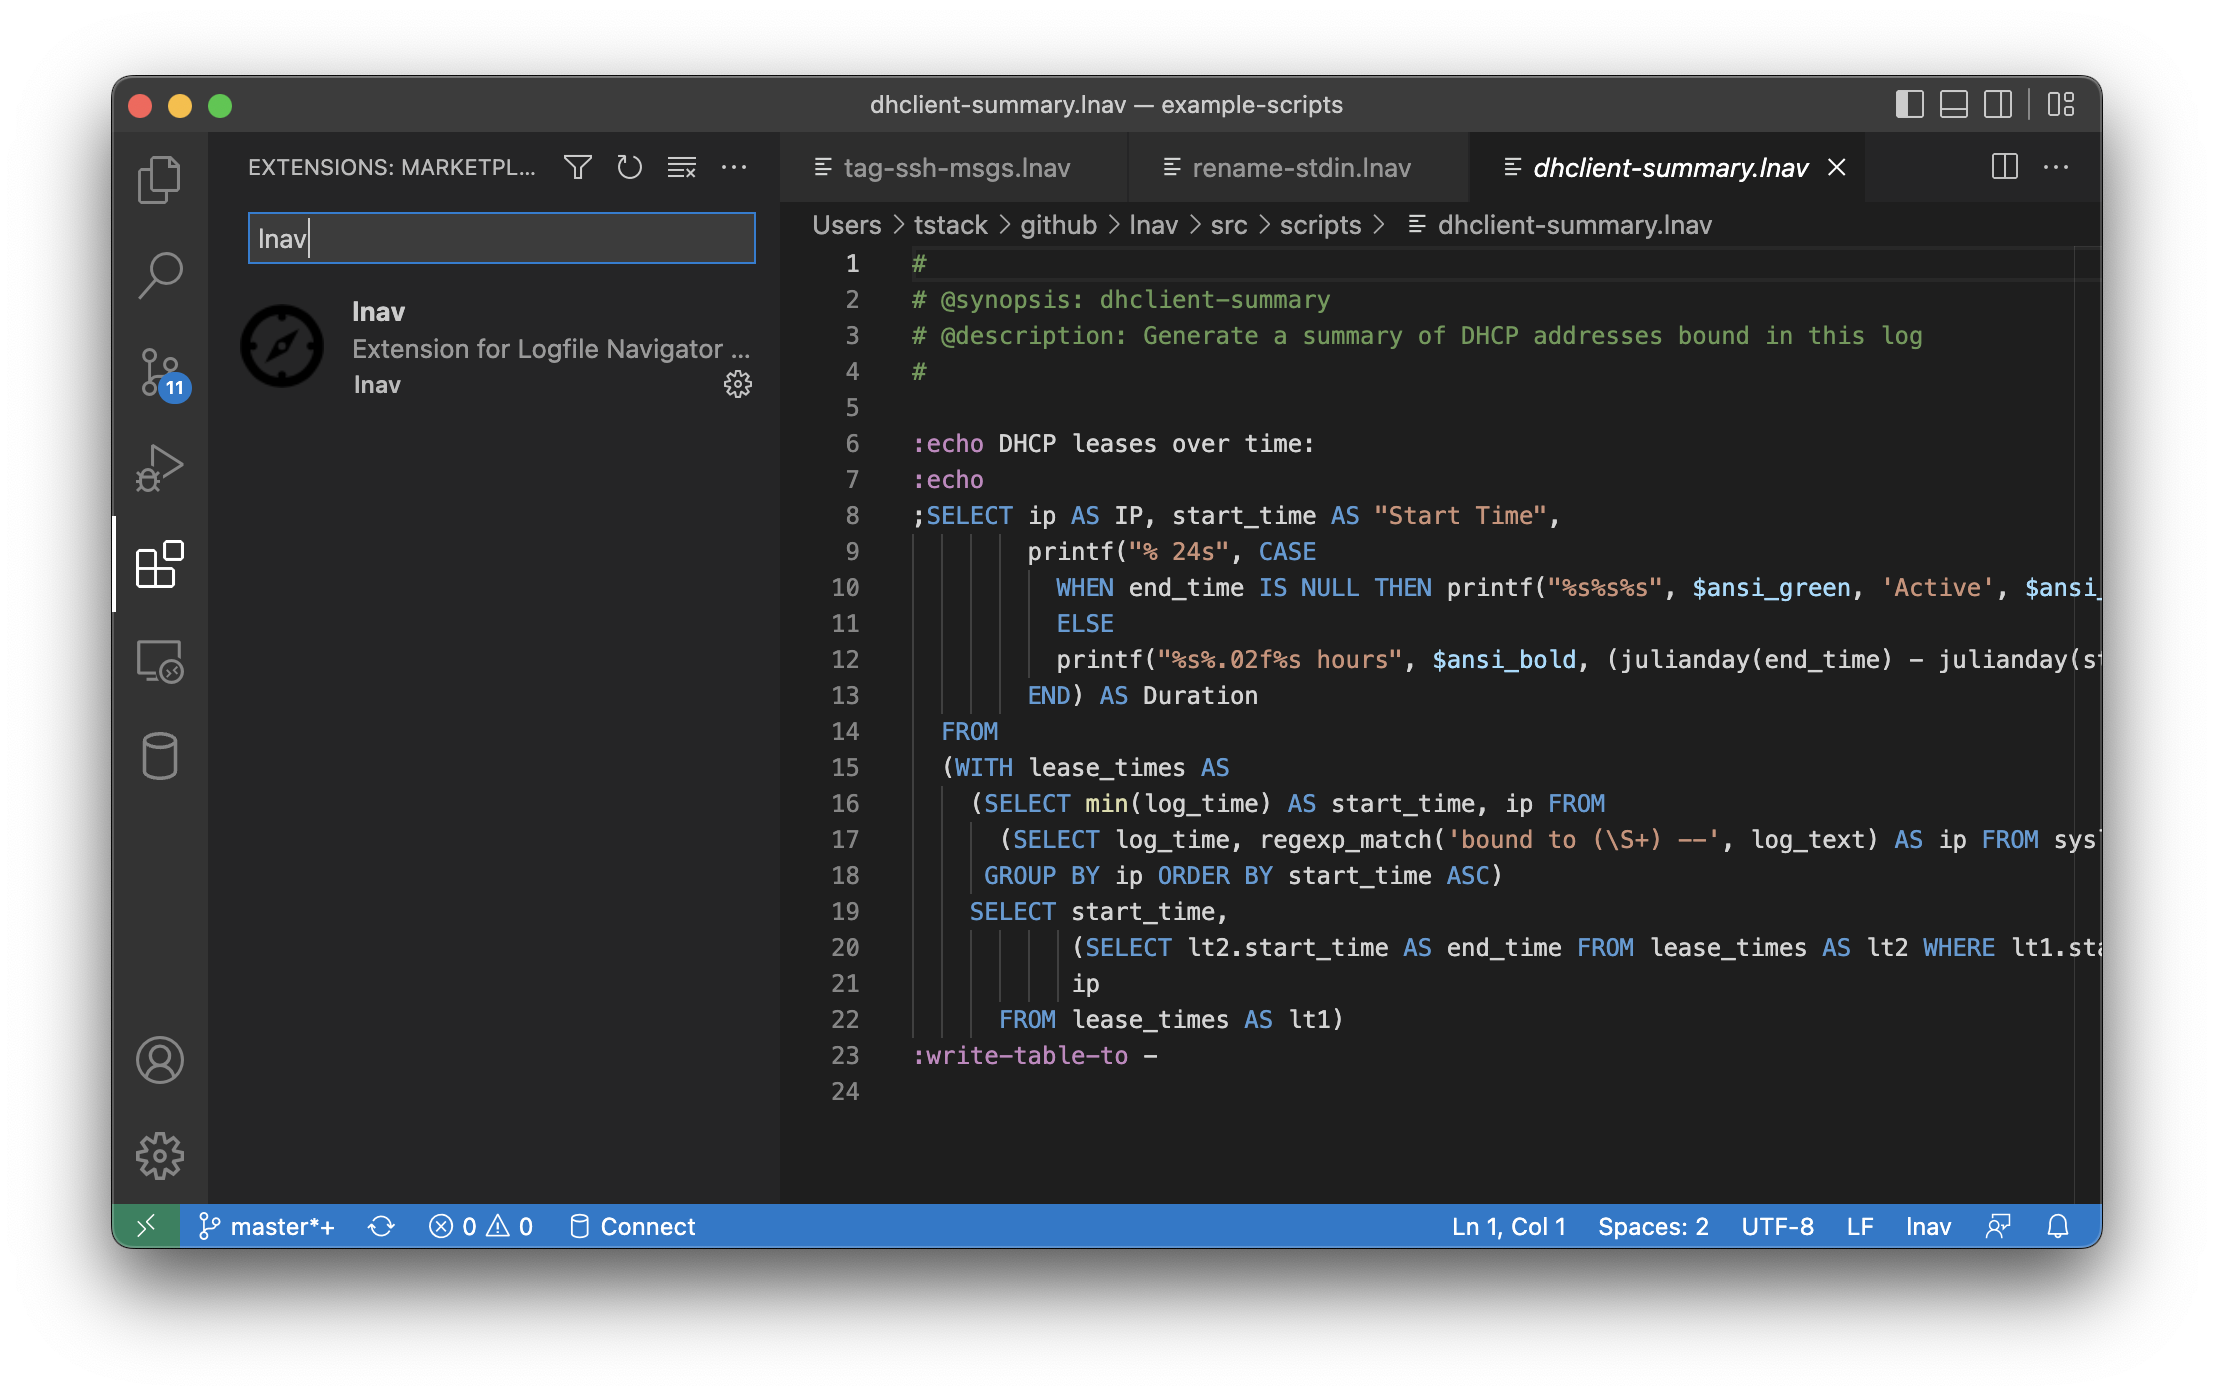
The ;.msgformats command has been broken for a few releases, but
its functionality can be replicated using the script below.
Copy the following to a file named msgformat.lnav and place it in the
formats/installed lnav configuration directory.
;SELECT count(*) AS total,
       min(log_line) AS log_line,
       min(log_time) AS log_time,
       humanize_duration(timediff(max(log_time), min(log_time))) AS duration,
       group_concat(DISTINCT log_format) AS log_formats,
       log_msg_format
    FROM all_logs
    GROUP BY log_msg_format
    HAVING total > 1
    ORDER BY total DESC
:switch-to-view db
Q2: What is the operating system version of the targeted system? (one word)
The answer to this question has the form 4.*.*.u3 as given in the
challenge. You can do a search in lnav by pressing / and then
entering a PCRE-compatible regular expression. In this case,
entering 4\.[^ ]+u3 will locate lines with the desired version
number of 4.2.4-1ubuntu3.
Q3: What is the name of the compromised account?
Using the findings of our initial analysis, the compromised account
is root.
Q4: Consider that each unique IP represents a different attacker. How many attackers were able to get access to the system?
Answering this question will require analyzing messages in the auth.log
file. Specifically, we will need to find failed password attempts, like
the following one and extract the user ID and IP address:
Apr 18 18:22:07 app-1 sshd[5266]: pam_unix(sshd:auth): authentication failure; logname= uid=0 euid=0 tty=ssh ruser= rhost=61.151.246.140 user=root
The failed attempts will give us the attacker IP addresses. However, we
don’t want to confuse attacker IPs with legitimate logins. So, we’ll
need to look for successful login messages like this one:
Mar 16 08:26:06 app-1 sshd[4894]: Accepted password for user3 from 192.168.126.1 port 61474 ssh2
Analyzing log data in lnav is done through the SQL interface. The
log messages can be accessed through SQL tables that are automatically
defined for each log format. However, that is pretty cumbersome
since there would be a lot of regex SQL function calls cluttering up
the queries. Instead, we can use the :create-search-table
command to create a SQL table that matches a regular expression
against the log messages and extracts data into column(s). We can
then write much simpler SQL queries to get the data we’re interested
in.
First, lets create an auth_failures table for the authentication
failure log messages:
:create-search-table auth_failures authentication failure; .* rhost=(?<ip>\d+\.\d+\.\d+\.\d+)\s+user=(?<user>[^ ]+)
Now, let’s try it out by finding the IPs of failed auth attempts:
;SELECT DISTINCT ip FROM auth_failures
Next, lets create an auth_accepted table for the successful
authentications:
:create-search-table auth_accepted Accepted password for (?<user>[^ ]+) from (?<ip>\d+\.\d+\.\d+\.\d+)
Now that we have these two tables, we can write a query that
gets the IPs of failed auth attempts that eventually
succeeded. We further filter out low failure counts to
eliminate human error. The full query is as follows:
;SELECT ip, count(*) AS co FROM auth_failures WHERE user = 'root' AND ip IN (SELECT DISTINCT ip FROM auth_accepted) GROUP BY ip HAVING co > 10
The results are the following six IPs:
┏━━━━━━━━━━━━━━━┳━━━━┓
┃      ip       ┃ co ┃
┡━━━━━━━━━━━━━━━╇━━━━┩
│61.168.227.12  │ 386│
│121.11.66.70   │2858│
│122.226.202.12 │ 626│
│219.150.161.20 │3120│
│222.66.204.246 │1016│
│222.169.224.197│ 358│
└━━━━━━━━━━━━━━━┴━━━━┘
Q5: Which attacker’s IP address successfully logged into the system the most number of times?
The attacker IPs were found using the query in the previous
question, but the counts are for the number of failed auth
attempts. Probably the easiest thing to do is create a SQL
view with the previous query. That can be done quickly by
pressing ; and then pressing the up arrow to go back in
the command history. Then, go to the start of the line and
prepend CREATE VIEW attackers AS before the SELECT.
That will create an attackers SQL view that we can use
to answer this question.
Now that we can easily get the list of attacker IPs, we
can write a query for the auth_accepted table that
finds all the successful auth messages. We then group
by IP and count to get the data we want:
;SELECT ip, count(*) AS co FROM auth_accepted WHERE ip IN (SELECT ip FROM attackers) GROUP BY ip ORDER co DESC
The results are:
┏━━━━━━━━━━━━━━━┳━━┓
┃      ip       ┃co┃
┡━━━━━━━━━━━━━━━╇━━┩
│219.150.161.20 │ 4│
│122.226.202.12 │ 2│
│121.11.66.70   │ 2│
│222.169.224.197│ 1│
│222.66.204.246 │ 1│
│61.168.227.12  │ 1│
└━━━━━━━━━━━━━━━┴━━┘
The top IP there is 219.150.161.20.
Q6: How many requests were sent to the Apache Server?
Logs that follow the Apache log format can be accessed by the
access_log SQL table. The following query will count the
log messages in each access log file:
;SELECT log_path, count(*) FROM access_log GROUP BY log_path
The results I get are:
┏━━━━━━━━━━━━━━━━━━━━━━━━━━━━━━━━━━━━━━━━━━━━━━━━━━━━━━━┳━━━━━━━━┓
┃                       log_path                        ┃count(*)┃
┡━━━━━━━━━━━━━━━━━━━━━━━━━━━━━━━━━━━━━━━━━━━━━━━━━━━━━━━╇━━━━━━━━┩
│/Users/tstack/Downloads/Hammered/apache2/www-access.log│     365│
│/Users/tstack/Downloads/Hammered/apache2/www-media.log │     229│
└━━━━━━━━━━━━━━━━━━━━━━━━━━━━━━━━━━━━━━━━━━━━━━━━━━━━━━━┴━━━━━━━━┘
It seems like they want just what is in the www-access.log
file, so the answer is 365.
Q7: How many rules have been added to the firewall?
Rules are added by the iptables -A command, so we can do a
search for that command and the status bar will show
“6 hits for “iptables -A””.
Using the auth_accepted table we created previously, this is
a pretty simple query for max(log_time):
;SELECT max(log_time) FROM auth_accepted WHERE ip = '219.150.161.20'
The result I get is:
✔ SQL Result: 2010-04-19 05:56:05.000
Q10: The database displayed two warning messages, provide the most important and dangerous one.
The database log messages come out in the syslog with a procname
of /etc/mysql/debian-start and are recognized as warnings.
Using this, we can write a filter expression
that filters the log based on SQL expression. For the syslog
file format, the procname is accessible via the :log_procname
variable and the log level is in the :log_level variable.
The following command puts this together:
:filter-expr :log_procname = '/etc/mysql/debian-start' AND :log_level = 'warning'
After running this command, you should only see about 15 lines
of the 100+k that was originally shown. Taking a look at these
lines, the following line seems pretty bad:
Mar 18 10:18:42 app-1 /etc/mysql/debian-start[7566]: WARNING: mysql.user contains 2 root accounts without password!
To clear the filter, you can press CTRL + R to reset the
state of the session.
Q12: Few attackers were using a proxy to run their scans. What is the corresponding user-agent used by this proxy?
The user-agent can be retrieved from the cs_user_agent
column in the access_log table. The following query
will get the unique user-agent names:
;SELECT DISTINCT cs_user_agent FROM access_log
The results I get are:
┏━━━━━━━━━━━━━━━━━━━━━━━━━━━━━━━━━━━━━━━━━━━━━━━━━━━━━━━━━━━━━━━━━━━━━━━━━━━━━━━━━━━━━━━━━━━━━━━━━━━━━━━━━━━━━━━━━━━━━━━━━━━━━━━━┓
┃                                                         cs_user_agent                                                          ┃
┡━━━━━━━━━━━━━━━━━━━━━━━━━━━━━━━━━━━━━━━━━━━━━━━━━━━━━━━━━━━━━━━━━━━━━━━━━━━━━━━━━━━━━━━━━━━━━━━━━━━━━━━━━━━━━━━━━━━━━━━━━━━━━━━━┩
│Apple-PubSub/65.12.1                                                                                                            │
│Mozilla/4.0 (compatible; MSIE 6.0; Windows NT 5.1)                                                                              │
│Mozilla/4.0 (compatible; MSIE 6.0; Windows NT 5.0)                                                                              │
│iearthworm/1.0, iearthworm@yahoo.com.cn                                                                                         │
│Mozilla/5.0 (Windows; U; Windows NT 5.1; en-US) AppleWebKit/532.5 (KHTML, like Gecko) Chrome/4.1.249.1045 Safari/532.5          │
│WordPress/2.9.2; http://www.domain.org                                                                                          │
│Mozilla/5.0 (Windows; U; Windows NT 5.1; es-ES; rv:1.9.0.19) Gecko/2010031422 Firefox/3.0.19                                    │
│Mozilla/5.0 (Macintosh; U; Intel Mac OS X 10_6_2; en-us) AppleWebKit/531.21.8 (KHTML, like Gecko) Version/4.0.4 Safari/531.21.10│
│Mozilla/5.0 (Macintosh; U; Intel Mac OS X 10.6; en-US; rv:1.9.2.3) Gecko/20100401 Firefox/3.6.3                                 │
│pxyscand/2.1                                                                                                                    │
│-                                                                                                                               │
│Mozilla/4.0 (compatible; NaverBot/1.0; http://help.naver.com/customer_webtxt_02.jsp)                                            │
│Mozilla/5.0 (Macintosh; U; Intel Mac OS X 10_6_2; en-us) AppleWebKit/531.22.7 (KHTML, like Gecko) Version/4.0.5 Safari/531.22.7 │
│Mozilla/5.0 (Windows; U; Windows NT 5.1; en-US) AppleWebKit/532.5 (KHTML, like Gecko) Chrome/4.1.249.1059 Safari/532.5          │
└━━━━━━━━━━━━━━━━━━━━━━━━━━━━━━━━━━━━━━━━━━━━━━━━━━━━━━━━━━━━━━━━━━━━━━━━━━━━━━━━━━━━━━━━━━━━━━━━━━━━━━━━━━━━━━━━━━━━━━━━━━━━━━━━┘
The pxyscand/2.1 name seems to be the one they want.
]]>